
A Guide To Index Funds
- Nov 29, 2021
- 20 min read
Updated: Jul 11, 2025

Index funds represent a method of investment that involves placing your trust in the overall growth of an economy. Simply put, this means investing your hard-earned money in the complete index of a particular country. Some of the most prominent indices include the NSE, BSE, NYSE, Nasdaq, S&P 500, Dow Jones, FTSE 100, and SSE, among many others. This wide selection highlights the numerous opportunities available to grow your wealth, even passively.
Selecting the right index is crucial, as it directly influences your potential returns. Therefore, our first step involves identifying the most consistent and reliable markets. This will be done using specific quantitative indicators such as Gross Domestic Product (GDP), forecasted growth rate, index Compounded Annual Growth Rate (CAGR), and prevailing bank interest rates.
The primary objective is to assess the stability of each economy. To make this analysis more intuitive, we have used a colour coded system: green indicates high stability, yellow suggests moderate stability with some fluctuations, and red denotes low stability and a highly volatile market.
Table 1:

For the qualitative analysis, we examined the current socio-economic and political landscape of each country under consideration. Based on this evaluation, several nations were excluded from our investment focus. Brazil was eliminated due to its unstable growth trajectory and high production costs. The United Kingdom was ruled out owing to a significant decline in income levels in 2020 and the economic uncertainty following its exit from the European Union (Brexit). Hong Kong was excluded as well, primarily because of ongoing protests and its escalating trade tensions with the United States. Canada, despite its stability, was not considered due to the limited size of its market. China also presented several concerns: ongoing political friction with major economies such as the United States and India, a restrictive policy environment for foreign investors, and increasing investor withdrawal from its markets.
India and the United States, in contrast, stood out in both quantitative and qualitative terms. India, as a rapidly developing economy, exhibits strong future growth potential and is poised for a significant bull run. This is largely due to extensive investments being made by numerous multinational corporations into the Indian market. Meanwhile, the United States is home to well-established companies known for their innovation, expertise, and global market dominance. Its leadership position in the global economy makes it a highly attractive investment destination.
This analysis clearly indicates that India and the United States are the two economies most aligned with our investment objectives: long-term stability and consistent growth. India, in particular, has shown remarkable progress since the pandemic. It is widely regarded as one of the fastest-growing economies, attracting major multinational corporations seeking to establish or expand operations in the region. The central government has also demonstrated a strong commitment to maintaining economic stability, despite global slowdowns.
Several key factors have contributed to the influx of investment into the Indian economy. These include the large-scale export of Covishield vaccines, improved government spending patterns, stronger international trade relations, targeted initiatives to revive key industries, an effective national budget, and increased government expenditure aimed at economic recovery. These developments have had a transformative impact, placing India in a highly favorable position for future growth.
Based on this comprehensive assessment, the Indian market emerges as the most promising environment for investment. The methodology used in our study not only provides a detailed analytical framework but also supports our conclusion with concrete evidence. All three of us have personally invested in the Indian market and have observed consistent, satisfactory returns. Through our experiences, we can confidently affirm that there is no more promising destination for investment than the Indian stock market, specifically the Nifty 50 and Sensex. While this claim may seem bold, we believe that the data and insights presented throughout this study will lead you to agree with our perspective. Hence, our entire analysis will be conducted in the context of the Indian market.
The Indian stock market is primarily represented by two benchmark indices: Sensex (BSE) and Nifty 50 (NSE). Sensex comprises the top 30 companies, while Nifty 50 includes the top 50 companies. Both indices are constructed using a float-adjusted, market capitalisation-weighted methodology. In simple terms, a company’s inclusion in the index is determined by its market capitalisation. If a company, say "X," outperforms another and achieves a higher market cap than the company currently ranked 50th, it will replace it in the Nifty 50. The same principle applies to Sensex.
For greater clarity, please refer to the table below, which lists all 50 companies currently included in the Nifty 50 index.
Table 2:
Company Name | Industry |
Adani Ports and Special Economic Zone Ltd. | Services |
Asian Paints Ltd. | Consumer Goods (FMCG) |
Axis Bank Ltd. | Financial Services |
Bajaj Auto Ltd. | Automobile |
Bajaj Finance Ltd. | Financial Services |
Bajaj Finserv Ltd. | Financial Services |
Bharat Petroleum Corporation Ltd. | Oil & Gas |
Bharti Airtel Ltd. | Telecommunication |
Britannia Industries Ltd. | Consumer Goods (FMCG) |
Cipla Ltd. | Pharmaceutical |
Coal India Ltd. | Metals |
Divi's Laboratories Ltd. | Pharmaceutical |
Dr. Reddy's Laboratories Ltd. | Pharmaceutical |
Eicher Motors Ltd. | Automobile |
Grasim Industries Ltd. | Cement & Cement Products |
HCL Technologies Ltd. | Information & Technology (IT) |
HDFC Bank Ltd. | Financial Services |
HDFC Life Insurance Company Ltd. | Financial Services |
Hero MotoCorp Ltd. | Automobile |
Hindalco Industries Ltd. | Metals |
Hindustan Unilever Ltd. | Consumer Goods (FMCG) |
Housing Development Finance Corporation Ltd. | Financial Services |
ICICI Bank Ltd. | Financial Services |
Information & Technology (IT)C Ltd. | Consumer Goods (FMCG) |
Indian Oil Corporation Ltd. | Oil & Gas |
IndusInd Bank Ltd. | Financial Services |
Infosys Ltd. | Information & Technology (IT) |
JSW Steel Ltd. | Metals |
Kotak Mahindra Bank Ltd. | Financial Services |
Larsen & Toubro Ltd. | Construction |
Mahindra & Mahindra Ltd. | Automobile |
Maruti Suzuki India Ltd. | Automobile |
NTPC Ltd. | Power |
Nestle India Ltd. | Consumer Goods (FMCG) |
Oil & Natural Gas Corporation Ltd. | Oil & Gas |
Power Grid Corporation of India Ltd. | Power |
Reliance Industries Ltd. | Oil & Gas |
SBI Life Insurance Company Ltd. | Financial Services |
Shree Cement Ltd. | Cement & Cement Products |
State Bank of India | Financial Services |
Sun Pharmaceuticalceutical Industries Ltd. | Pharmaceutical |
Tata Consultancy Services Ltd. | Information & Technology (IT) |
Tata Consumer Products Ltd. | Consumer Goods (FMCG) |
Tata Motors Ltd. | Automobile |
Tata Steel Ltd. | Metals |
Tech Mahindra Ltd. | Information & Technology (IT) |
TInformation & Technology (IT)an Company Ltd. | Consumer Goods (FMCG) |
UPL Ltd. | Fertilisers & Pesticides |
UltraTech Cement Ltd. | Cement & Cement Products |
Wipro Ltd. | Information & Technology (IT) |
The following are the top 50 companies listed on the Indian stock exchange that collectively form the Nifty 50 index. Their rankings are dynamic and fluctuate based on market capitalisation. These companies are the backbone of the Indian economy, contributing significantly to its growth and stability. While many of us have heard or read about these highly profitable corporations, a large number remain unaware of the wide range of brands they own and operate.
For instance, Hindustan Unilever Limited (HUL) owns a variety of popular consumer brands such as Axe, Boost, Dove, Horlicks, Knorr, Lifebuoy, Lipton, Lux, Magnum, Pepsodent, Pond’s, Vaseline, Bru, Sunsilk, Lakmé, Surf Excel, Rin, Red Label, Taaza, and Taj Mahal, among others. Similarly, Nestlé India Limited owns brands like Nescafé, Nestea, KitKat, Munch, Milkybar, and Bar One. These are only two examples from the fast-moving consumer goods (FMCG) sector. The Nifty 50 index includes 50 companies from 13 diversified sectors, each of which plays a critical role in the economy. These sectors include:
Consumer Goods – covering essential FMCG products
Automobile – enabling efficient transportation
Information & Technology – supporting research, development, and technological advancement (Quaternary Sector)
Pharmaceuticals – providing essential healthcare solutions
Financial Services – managing the banking and finance ecosystem
Metals, Construction, Cement and Cementing Products – forming the backbone of infrastructure (Secondary Sector)
Oil and Gas, Power – ensuring steady energy supply
Fertilizers and Pesticides – supporting agricultural productivity (Primary Sector)
Telecommunications – enabling seamless communication
Services – delivering key facilities including education (Tertiary Sector)
These 13 sectors together represent all the foundational elements required to sustain and grow an economy.
Every time you purchase something—whether it’s a pen or an insurance policy, a packet of Maggi or a bar of Cadbury, your monthly Jio recharge or petrol for your car, Aashirvaad atta or Tata Salt, Tide detergent or Vim dishwashing liquid, medicine for a loved one or a Royal Enfield bike for your son, a timepiece for your spouse or a car for your daughter, or even a cup of Starbucks coffee or a luxury Jaguar vehicle—you are spending your hard-earned money to support these brands. In doing so, you are indirectly contributing to the growth and profitability of the companies listed in the Nifty 50 index.
Each sale made by these companies adds to their revenue and, eventually, to their market capitalisation. This leads to an increase in their stock prices, thereby contributing to the overall rise in the value of the Nifty 50 and Sensex indices. In essence, every purchase you make is building wealth—not for you directly, but for those who have invested in these companies through index funds.
The movement of the Nifty 50 index is determined by the average performance of its constituent stocks. For example, if all 50 companies in the index record gains on a given day, and the average increase in stock price is 1.15%, then Nifty will also show a gain of 1.15% for that day. The same logic applies in the case of a decline. Both Sensex and Nifty generally move in tandem, with only minor differences arising due to the different number of companies in each index (30 in Sensex versus 50 in Nifty).
For better understanding, please refer to the visual references provided below.
Image 1:
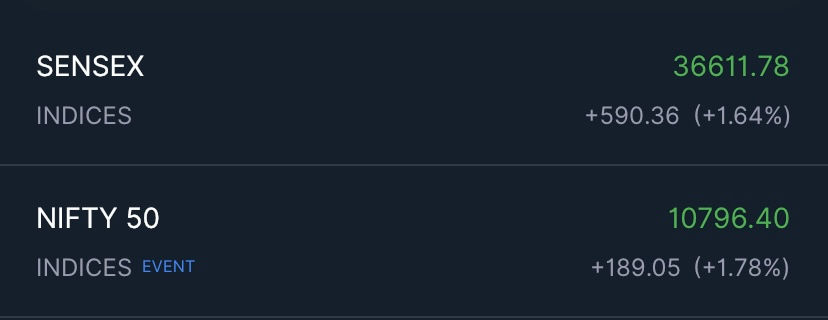
Source: Zerodha (Kite)
Image 2

Source: Zerodha (Kite)
Index funds are intrinsically linked to the economic performance of their respective countries. In simple terms, if a nation's economy experiences growth, its index fund will reflect that growth. Conversely, if the economy declines, the index fund is also likely to decrease in value. Therefore, any improvement in India's economic indicators will likely result in a corresponding rise in its stock market performance.
There are three primary macroeconomic objectives that are considered essential for the healthy functioning of an economy:
Economic Growth
Low Unemployment
Low and Stable Rate of Inflation
Any positive movement in these macroeconomic goals typically contributes to a stronger and more stable stock market. Similarly, if there is a decline in these indicators, it can have an adverse effect on market performance.
Economic growth is driven by several key factors, including increased consumption of goods and services, higher levels of investment, enhanced government spending, and an improved balance of payments. These elements are directly linked to a country's Gross Domestic Product (GDP) and Gross National Income (GNI), both of which are fundamental measures of economic health.
In addition, when multinational corporations (MNCs), startups, and other enterprises generate more employment opportunities, individuals gain access to a higher disposable income. With greater purchasing power, people can spend more, save more, and most importantly, invest more. This financial surplus not only enhances individual well-being but also contributes to the overall development of the economy.
This increase in disposable income allows individuals to break free from the cycle of poverty—a concept commonly referred to as the "poverty trap." The diagram below illustrates how individuals can escape this trap through economic advancement and increased investment capacity.
Image 3:

Source: https://mrbrackrog.wordpress.com/economics/grade-12-economics/introduction-to-economic-development/
Lastly, a low and stable rate of inflation typically leads to a gradual reduction in interest rates. This scenario is highly beneficial for investors, as interest rates and the stock market share an inverse relationship. When the government lowers interest rates, the returns on traditional savings instruments—such as bank deposits—also decline. As a result, savers become less inclined to keep their money in banks and begin exploring alternative investment options.
In most cases, a significant portion of this redirected capital flows into the stock market. Even when individuals choose to invest in other avenues such as real estate or small businesses, the effect remains positive for the economy, as all these investments represent injections into the Indian financial system. In essence, it becomes a win-win situation for investors: they gain access to more lucrative investment opportunities, and the economy benefits from increased capital circulation.
The impact of these financial injections has been clearly visible in the remarkable performance of the Indian stock market since the onset of the COVID-19 pandemic. Traditionally, many individuals preferred saving money through Fixed Deposits (FDs), but this trend has shifted significantly. A growing number of people are now turning toward equity investments as a means of wealth creation.
According to data from the Securities and Exchange Board of India (SEBI), a record 14.2 million new demat accounts were opened by Indian investors in the financial year 2020–21 (FY21). This surge in participation played a key role in propelling the Nifty index from 8,000 points to 18,000 points in just 1.5 years—a clear reflection of how investor sentiment and economic factors together drive market growth.
All of this clearly demonstrates that the stock market is directly tied to the overall economy of a country. With the exceptional growth prospects India continues to exhibit, it is reasonable to place our confidence in the long-term success of the Indian economy. Many people often express concerns about the stock market’s volatility and the risk of losing money, and we acknowledge that this concern is valid. Selecting the right company to invest in can indeed be challenging, and stock prices can decline unexpectedly.
However, investing in a Nifty Index fund is fundamentally different. Unlike investing in a single company or a handful of stocks with the hope of earning a return, an index fund represents a diversified basket of the top 50 companies in the Indian economy. By investing in the index, you are not only reducing risk through diversification but also placing your trust in the overall growth of the country.
It is widely accepted that India’s economy will continue to grow over the long term. Although short-term slumps or slowdowns may occur due to various factors, the broader trend is one of steady progress and resilience. This long-term perspective enhances the safety of your investment. Even if the current top 50 companies were to decline or collapse, the next set of high-performing companies would replace them in the index, ensuring the continuity and strength of the market.
Even in a hypothetical worst-case scenario such as a global conflict like World War III, the stock market would not drop to zero. Certain essential sectors would continue to function and generate economic activity. These include:
Fast-Moving Consumer Goods (FMCG) – which cater to daily needs and basic necessities
Medical Industry – including hospitals and pharmaceutical companies providing healthcare
Arms Industry – comprising companies that manufacture and supply weapons to the military
These sectors would dominate the index in such circumstances, and their performance would help stabilize the market. This serves as strong evidence that, regardless of the crisis—whether it’s an economic slowdown, a change in government, political unrest, or even the collapse of major corporations—index values will never fall to zero.
Our evaluation thus far has provided a thorough understanding of how the stock market operates, the relative safety of investing in index funds, and the reasons why India currently stands out as one of the best places to invest.
To further support our analysis, we now consider a valuable quantitative tool: the Price-to-Earnings (PE) Ratio. The formula for calculating the PE ratio is:
PE Ratio = Price ÷ Earnings
This ratio indicates the amount of money an investor needs to invest in order to earn 1 INR (or 1 USD, depending on the currency). For instance, if the PE ratio of an index is 25, it means that an investor must invest ₹25 to earn ₹1 in return.
The PE ratio is a versatile metric used to assess the utility or valuation of an asset. It is not limited to stock indexes alone—it can also be applied to individual stocks, cryptocurrencies, fixed deposits (FDs), real estate, government bonds, and other investment avenues. By helping investors understand how much they are paying relative to the earnings generated, the PE ratio plays a key role in informed financial decision-making.
The Price-to-Earnings (PE) ratio serves as a key indicator in evaluating the valuation of an index. It allows investors to determine whether the market is currently overvalued or undervalued. You can track the PE ratio of both Nifty and Sensex through the official NSE website here: NSE PE Ratio Historical Data
To simplify the evaluation process, we have defined a PE range to help assess market conditions:
A PE ratio below 16.5 suggests that the market is significantly undervalued, presenting a strong opportunity for investment.
A PE ratio above 34.5 indicates an overvalued or expensive market.
The PE ratio can also be interpreted as a reflection of market sentiment. A low PE ratio (<16.5) often implies pessimism among investors, likely because they have experienced losses and are choosing to exit the market. On the other hand, a high PE ratio (>34.5) signifies optimism, as investors see consistent upward trends and are more inclined to invest.
This insight leads to an important principle: to achieve success in the stock market, it is often wise to act contrary to the majority. When most people are fearful and selling, it may be the best time to buy; when most are overly optimistic, caution is advisable.
Furthermore, the price of an index (measured in points) can be calculated using a simple rearrangement of the PE formula:
Price = Earnings × PE Ratio
For example, if a company’s earnings are ₹50 and the PE ratio is 10, the price would be:₹50 × 10 = ₹500
Now, assume that after a year or two, the earnings rise to ₹75 while the PE ratio remains constant. The new price would then be:₹75 × 10 = ₹750
This demonstrates that the price of a stock (or index) is influenced by two main factors:
Earnings
PE Ratio
Historically, the PE ratio of Nifty and Sensex does not fall below 6 or rise above 70 under normal conditions. Such extremes are exceptionally rare. Generally, the ratio tends to fluctuate within the range of 12 to 48 (±2). Over the long term, the average PE ratio of the market hovers around 25.5.
Based on this understanding, we estimate that the Nifty index could potentially reach 100,000 points within the next 10 to 12 years, even though it is currently trading around 18,000 points. This projection is based on the consistent growth in earnings of the Nifty 50 companies, which is averaging around 18% annually.
Assuming the PE ratio remains stable over this period, we can use the formula:
Price = Earnings × PE Ratio
By applying the expected increase in earnings over the next decade and holding the PE ratio constant, this formula provides a rational basis for our long-term forecast of Nifty reaching the 100,000 mark.
Table 3:

The table presented above illustrates that, by the year 2031, the Nifty index is projected to surpass 100,000 points—assuming both the earnings of its constituent companies and the PE ratio remain constant throughout this 10–12 year period. If either of these variables increases over time, the duration required to reach the 100,000 mark would shorten further.
This projection highlights the power of compounding. For example, an investment of ₹18,000 earning a Compounded Annual Growth Rate (CAGR) of 18% would grow to more than ₹1.10 lakh in 10–12 years. This exponential growth underlines the value of long-term investing in fundamentally sound instruments like index funds.
While the three of us have only been investing for about a year, and our age—just 17—may lead some to view our perspective as less credible, we recognize the importance of backing our analysis with expert opinion. To reinforce our findings, we reference a prediction made by the late Mr. Rakesh Jhunjhunwala, one of India's most respected investors. In a statement published by Livemint, he projected that Nifty would reach 90,000–100,000 by the year 2030.
This alignment with expert opinion lends strong support to our evaluation and builds further confidence in the long-term potential of the Indian stock market.
Our primary objective is to focus on the bigger picture and approach investments with a long-term, rational mindset. It is important not to be swayed by temporary market fluctuations or economic slowdowns, which often lead to pessimism among a large number of investors. These short-term dips might cause your portfolio to decline by 10–15%, but history shows that markets recover—often at a much faster pace than anticipated.
Patience is the key. By staying consistent and not reacting impulsively to short-term volatility, investors position themselves to reap significant rewards in the long run.
Table 4:
Value of Sensex in 1990 | 712 |
Value of Sensex in 2021 | 60294 |
Compounded Annual Growth Rate (CAGR) | 15.95% |
Calculating the average Compounded Annual Growth Rate (CAGR) of the Sensex from 1990 to 2021, we find that the index has delivered a consistent return of 15.95% annually over this 30-year period. Sustained annual growth at this rate would have significantly increased the value of any long-term investment—turning modest initial capital into substantial wealth.
Looking ahead, we predict that the CAGR for the next 30 years will likely exceed 16%, given the strong structural growth India is poised to experience. The Indian economy appears to be entering a historic bull run, one that may surpass all previous growth phases in both scale and longevity.
If you have read this far in our analysis, you might now be convinced that index funds are among the most reliable and consistent tools for wealth creation. They combine safety through diversification with the potential for long-term capital appreciation.
To strengthen this understanding, let us now estimate the potential returns from investing in an index fund today. Consider a scenario where you make a one-time lump sum investment and decide not to add any further contributions—keeping the strategy simple and requiring minimal involvement.
Assuming your initial investment is INR 100,000, and the CAGR remains consistent over time, your portfolio's growth over the years would appear as follows (refer to Table 5 for detailed projections):
(The table would typically show the projected value of ₹100,000 over a given number of years at a constant CAGR, demonstrating how compounding amplifies returns over time.)
This approach illustrates not just the potential of index fund investing, but also the power of patience and consistency in achieving long-term financial goals.
Table 5:

If you choose to invest in index funds but prefer not to commit a large amount upfront, and instead want to invest smaller amounts regularly, there is a highly effective strategy known as a Systematic Investment Plan (SIP). This approach allows you to define a fixed investment amount that is contributed to index funds on a periodic basis—monthly, quarterly, semi-annually, or annually—depending on your financial comfort and goals.
SIP is particularly advantageous for individuals looking to avoid financial strain while still building long-term wealth. One of the key benefits of SIPs is their ability to manage market volatility effectively. Since your investments are spread out over time, you purchase units at different market levels, which averages your cost of investment and reduces the impact of short-term market fluctuations.
Let’s assume you decide to invest INR 10,000 each month into an index fund. Over time, this disciplined and consistent strategy can lead to significant portfolio growth. The compounding effect—combined with the historical performance of index funds—makes SIPs one of the most practical and rewarding methods of long-term investing.
The projected value of such monthly investments, based on expected market performance, can be seen in Table 6.
(Table 6 would typically illustrate the total amount invested, the projected portfolio value at various intervals—5, 10, 15, 20 years—based on assumed CAGR rates, and how the power of compounding multiplies returns significantly over time.)
Through this method, even a modest monthly contribution can transform into a sizable corpus over the years—offering financial security, independence, and peace of mind, all while keeping the investment process simple and stress-free.
Table 6:

If you find yourself truly fascinated by the concept of index funds, recognize their long-term wealth creation potential, and decide to begin your investment journey with both a lump sum investment and a Systematic Investment Plan (SIP), this combination can significantly enhance your returns. This dual strategy maximizes the impact of compounding and helps you make the most of both market lows and highs.
By investing a lump sum at the outset, your capital begins compounding immediately. Following it up with regular SIP contributions ensures that your average purchase cost is optimized over time, while also making the investment process more disciplined and less sensitive to market volatility.
We highly recommend this combined approach as it offers the best balance of growth, risk management, and long-term return on investment.
Let’s assume you choose to invest:
An initial lump sum of INR 100,000,
Followed by monthly SIP contributions of INR 10,000.
Over the years, this strategy would build a robust portfolio, leveraging both immediate compounding and regular reinforcements through SIP. The projected growth of your portfolio under these assumptions is outlined in Table 7.
(Table 7 would typically show cumulative investment over time, projected portfolio value at various intervals—5, 10, 15, and 20 years—assuming a constant CAGR, highlighting the significant wealth generation possible through this dual investment strategy.)
This approach ensures that you are not only investing early but also continuing to build wealth consistently—making it one of the most effective strategies for long-term financial success.
Table 7:

Although we strongly believe that index funds will offer even better returns in the future, particularly given India's exceptional growth prospects, we have based our projections on historical performance to provide a more conservative and assured estimate of future returns. This method ensures that our evaluation is grounded, realistic, and trustworthy.
Assuming you start investing in index funds today, using a combined strategy of both a lump sum and a monthly SIP for the next 30 years, and earn the same historical CAGR of 15.95%, the calculations are as follows:
Total Investment: ₹3,700,000
Future Value: ₹98,109,352.78
It’s important to note that this projection does not include dividends, which many index funds distribute annually or quarterly. These dividends can either be reinvested to enhance compounding or used for personal expenses, depending on your financial goals.
As mentioned earlier, index funds have historically shown remarkable consistency. Given India's anticipated economic trajectory and increasing investor participation, there is a strong likelihood that the future CAGR could exceed 15.95%. Even a modest increase of 1% in CAGR over the 30-year period can have a substantial impact on your final portfolio value due to the power of compounding.
To illustrate this, please refer to the table below which compares the future value of the same investment at different CAGR rates:
(This table would typically show the projected portfolio values at CAGR rates of 15.95%, 16.95%, 17.95%, etc., highlighting the exponential impact of even small increases in annual returns over long investment horizons.)
This comparison reinforces the idea that even conservative investing—if done consistently and with patience—can lead to massive wealth generation, especially when aligned with the promising future of the Indian economy.
Table 8:

If you are planning to begin your investment journey today, it is essential to choose a reliable financial institution—one that offers low expense ratios and has a minimal risk of default. Based on these criteria, we recommend UTI Asset Management Company (UTI AMC).
UTI AMC is one of the oldest and most trusted asset management companies in India. What sets it apart is that it is owned by the Government of India, which adds a strong layer of credibility and assurance, significantly reducing the risk of financial mismanagement or default. Additionally, UTI offers some of the lowest expense ratios in the industry, making it a cost-effective choice for long-term investors.
If you wish to compare different AMCs, we recommend using the following platform:
To get started with your investment, simply create an account on UTI AMC's official website and select the:
UTI Nifty Index Fund – Direct Growth Plan
Choosing the DIRECT plan means you are investing without intermediaries or fund managers, thereby avoiding commission charges. This increases your potential return as you save on recurring management fees. It also ensures that your investment decisions are independent, not influenced by individuals who, if they had a strategy to consistently beat the market, might not be working standard jobs managing other people’s money.
Selecting the GROWTH option ensures that dividends are automatically reinvested. This accelerates compounding over time and enhances your portfolio’s long-term value.
All of the data and figures presented throughout this study have been calculated using Excel spreadsheets, applying accurate formulas tailored to each scenario. While the numbers might initially seem ambitious, the justifications and step-by-step evaluations provided in our analysis reflect a grounded understanding of financial principles and long-term market behavior.
As mentioned earlier, we are 17 years old, and while our age may raise doubts about our experience, we have done our best to provide a well-researched and thoroughly explained analysis. To further support our claims, we turn to one of the most respected investors of all time – Mr. Warren Buffett.
Warren Buffett has repeatedly emphasized that index funds are the best investment option for most individuals, especially for those looking for passive, long-term returns. You can read more about his views here:
To reinforce this belief, Warren Buffett made a $1 million bet with a hedge fund manager, challenging the idea that active fund management could outperform passive investing. The challenge spanned 10 years, and Buffett selected a simple S&P 500 index fund as his choice. The hedge fund manager picked a group of actively managed hedge funds.
The result? By the 8th year, the hedge fund manager conceded defeat. The index fund significantly outperformed the group of hedge funds, once again validating that passive investing—especially through index funds—offers superior returns over time with lower risk and lower cost.
This real-world example, backed by one of the greatest minds in investing, supports our conviction:Index funds are not only safe and consistent, but also incredibly powerful tools for wealth creation.
Image 4:

Please refer to the following articles to further reinforce the validity and strength of our arguments:
These articles clearly illustrate Warren Buffett’s enduring confidence in index funds as the most effective, low-cost, and reliable form of long-term investing. His public wager against high-fee hedge funds—and his decisive victory—proves that passive investing not only matches, but often outperforms complex and expensive active strategies.
In Conclusion
With the depth of research, data-driven analysis, and alignment with the investment philosophies of the world’s most successful investors, we firmly believe that index funds are the most consistent and dependable vehicle for wealth creation.
By investing in index funds, you are putting your money into the strongest companies across the economy—companies that grow with the country, survive downturns, and benefit from innovation, infrastructure, and rising consumption.
While others spend their hard-earned income on products and services that benefit these companies, you—by owning a piece of them through index funds—are quietly building wealth in the background. As Warren Buffett said, "If you don’t find a way to make money while you sleep, you will work until you die."
Index funds allow you to earn while you sleep—steadily, safely, and smartly.
We hope this study has helped you see the opportunity clearly—and we encourage you to take your first step toward building lasting financial freedom.
"The stock market is a device for transferring money from the impatient to the patient." Warren Buffett


Comments